Verinode HQ · Private Equity
Intelligence for PE-backed restoration platforms.
Roll up every operator in the portfolio onto one normalized line. See margin, cycle time, and compliance across the whole platform, catch a slipping operator before the quarterly board pack, and put each new acquisition on the same line the day it closes.
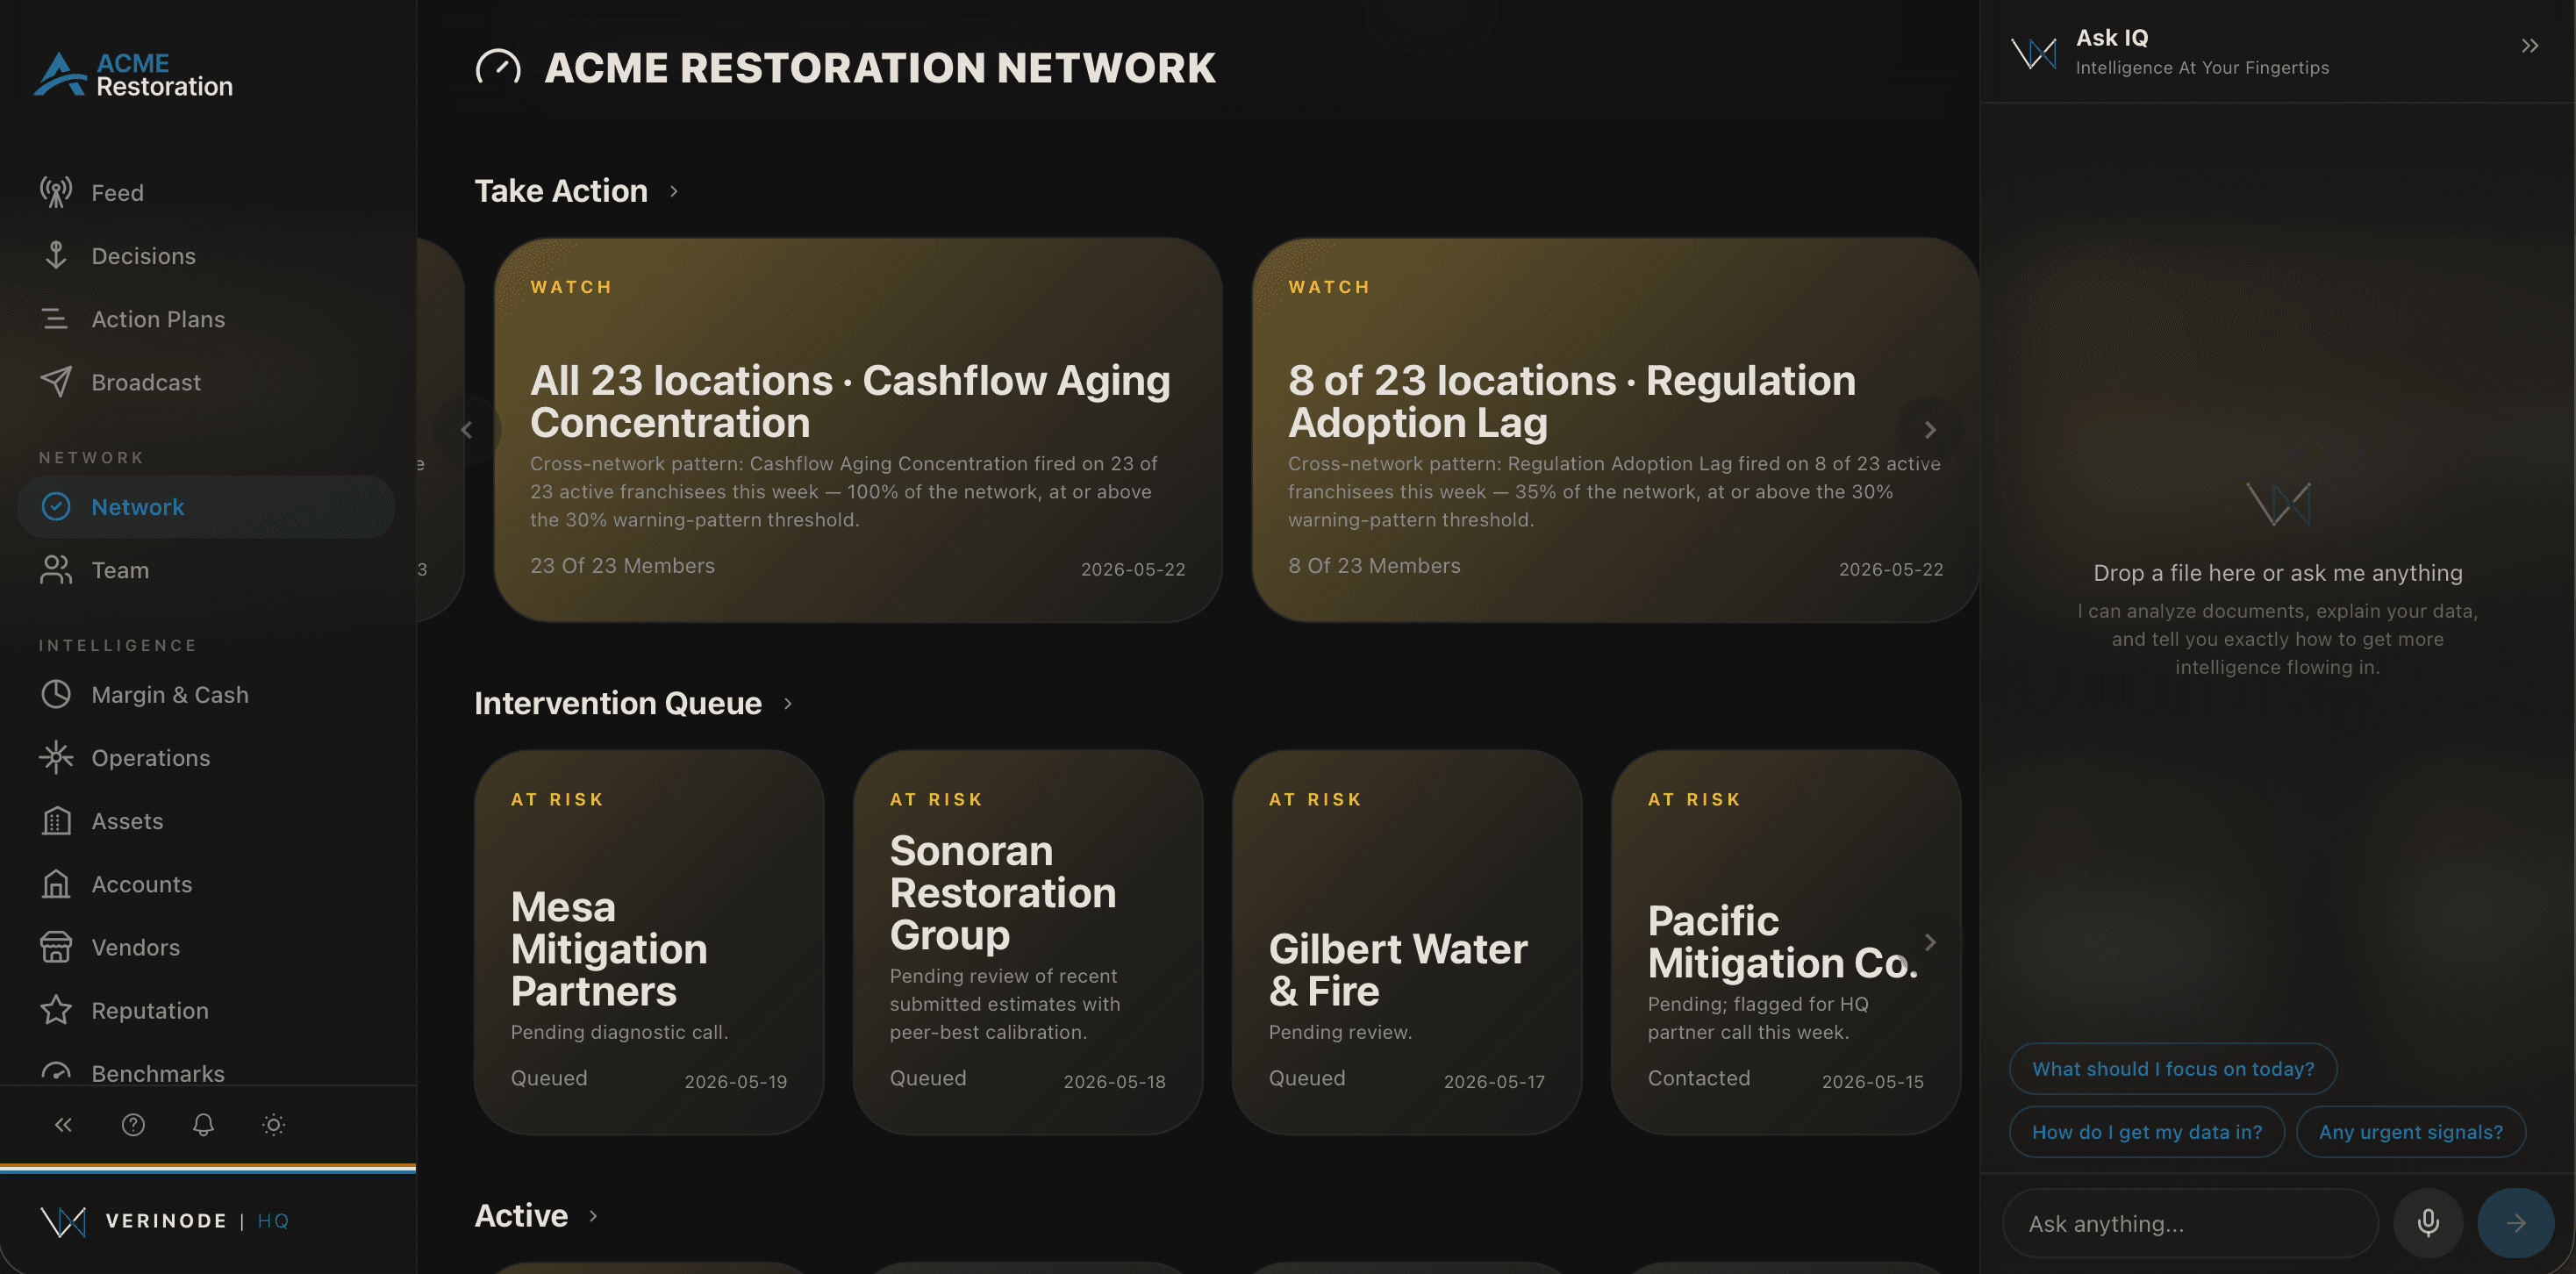
app.verinode.ai · HQ
The Spread Inside Your Portfolio
The gap between your best operator and your worst is the value creation sitting in plain sight.
Bottom-quartile operator
We'll show you exactly where you land, the moment you're in.
What membership includesOne normalized line across the whole portfolio.
Every operator keeps their own books; you see them compared like with like. Financials mapped to one chart of accounts and ranked on margin, cycle time, cash, and compliance, so the spread between your strongest and weakest operator is an opportunity you can act on, not a mystery buried in a dozen accounting systems.
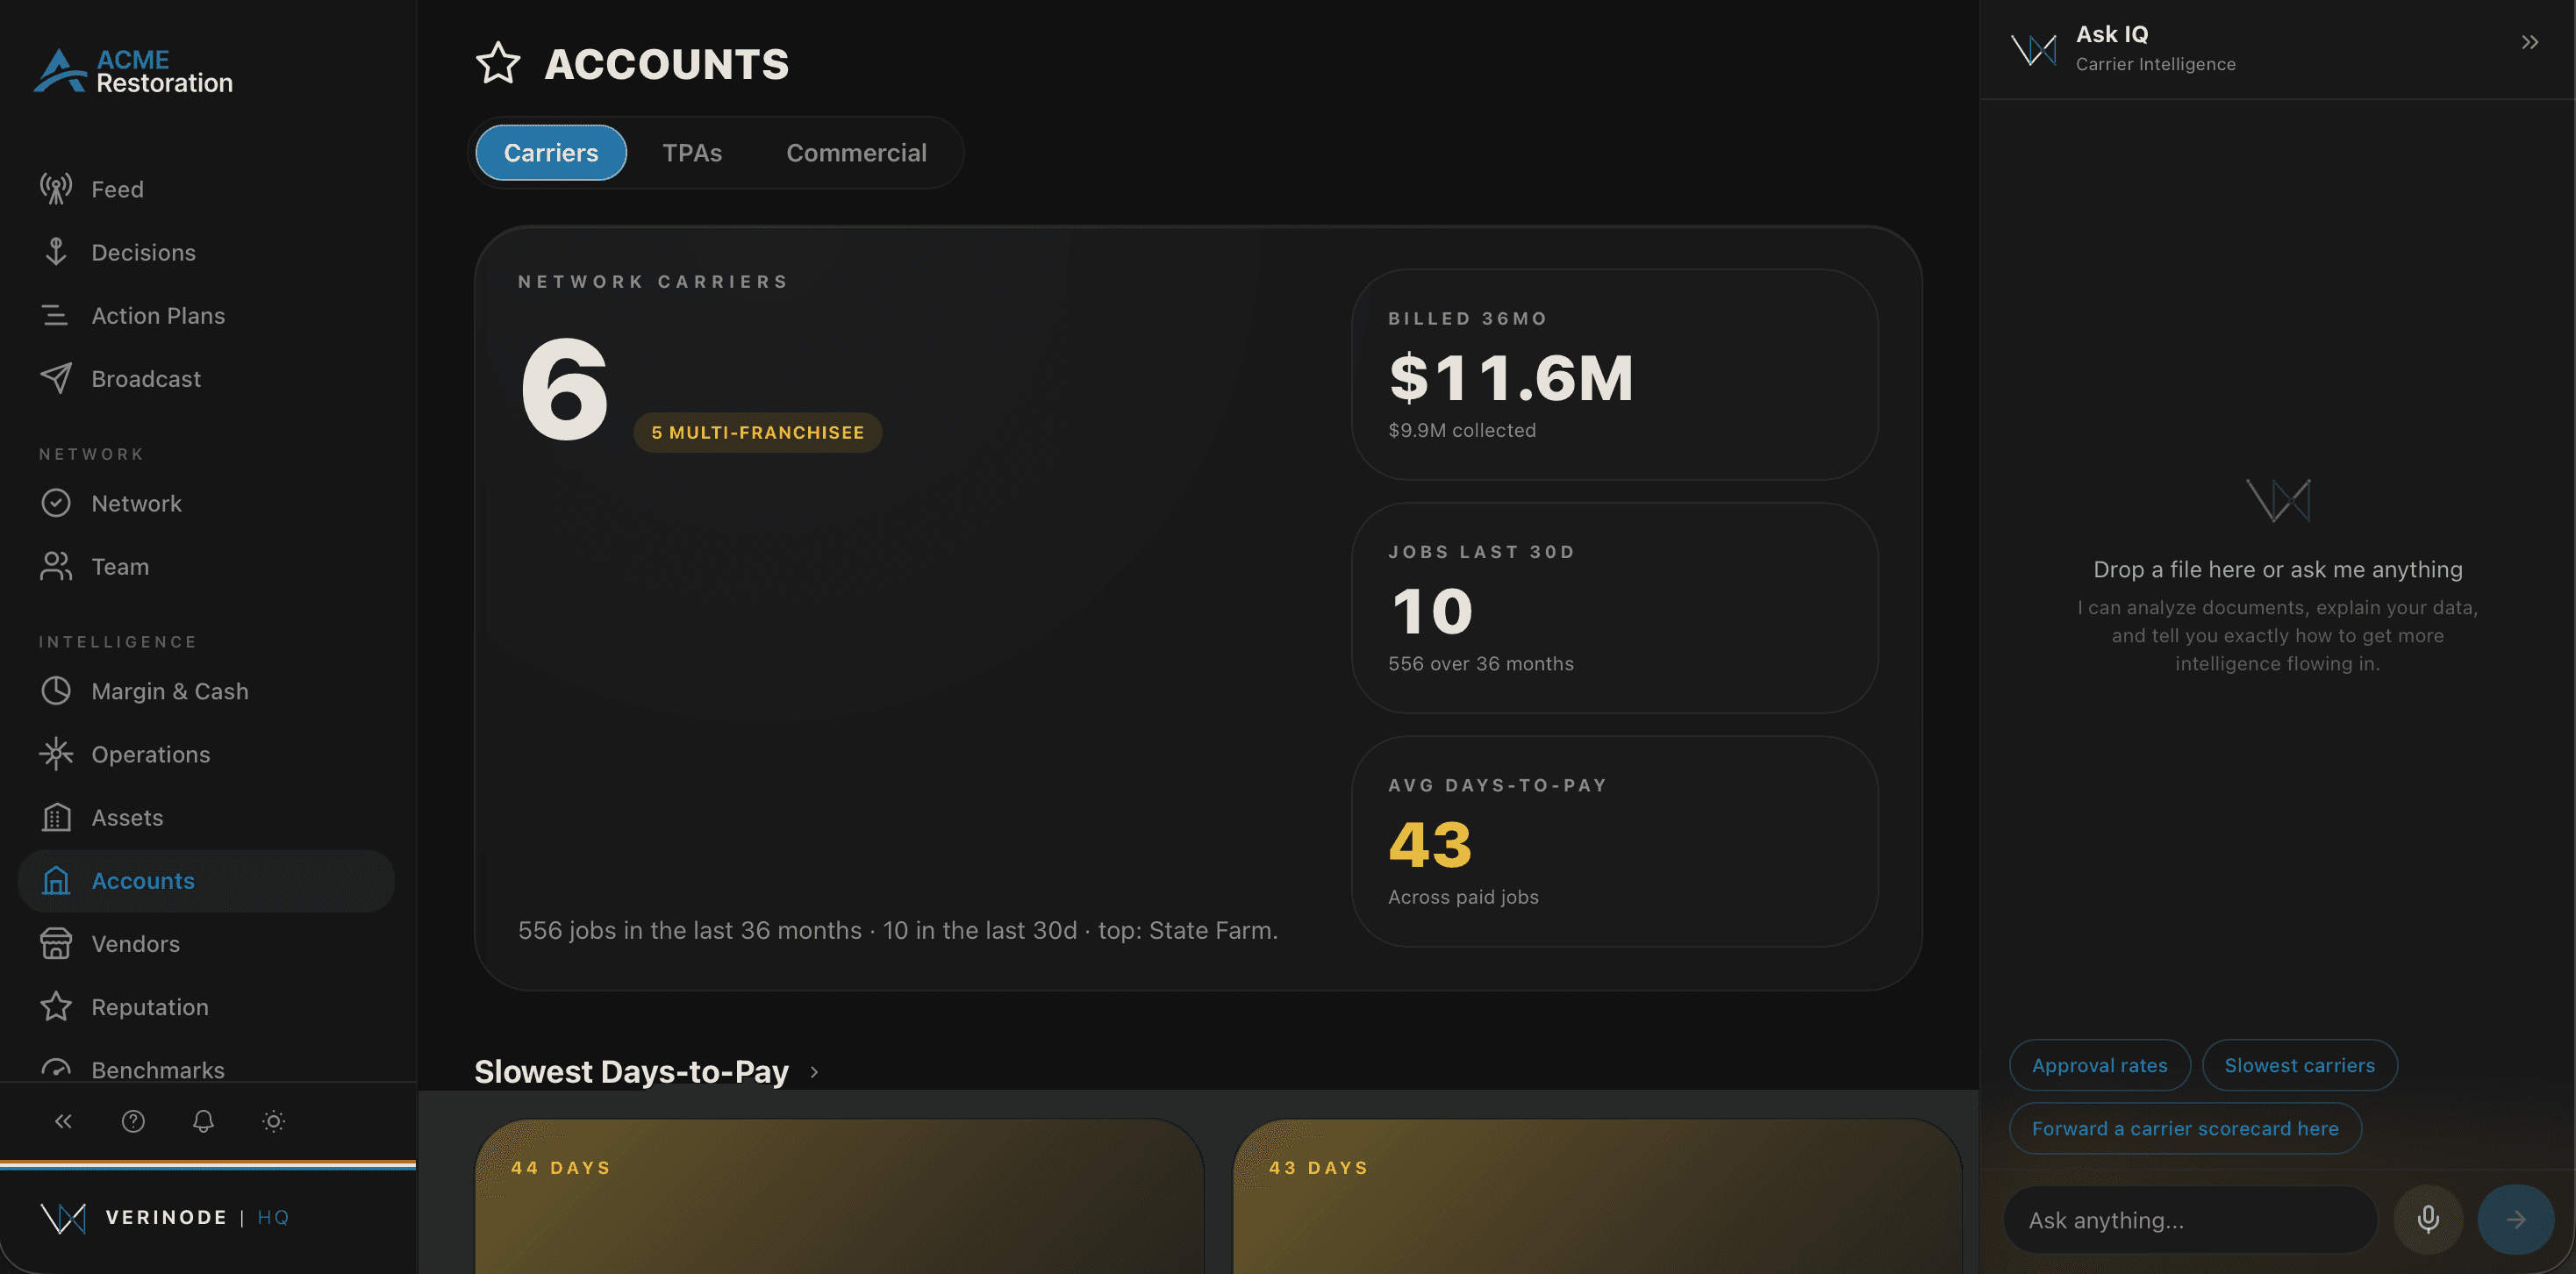
app.verinode.ai · HQ
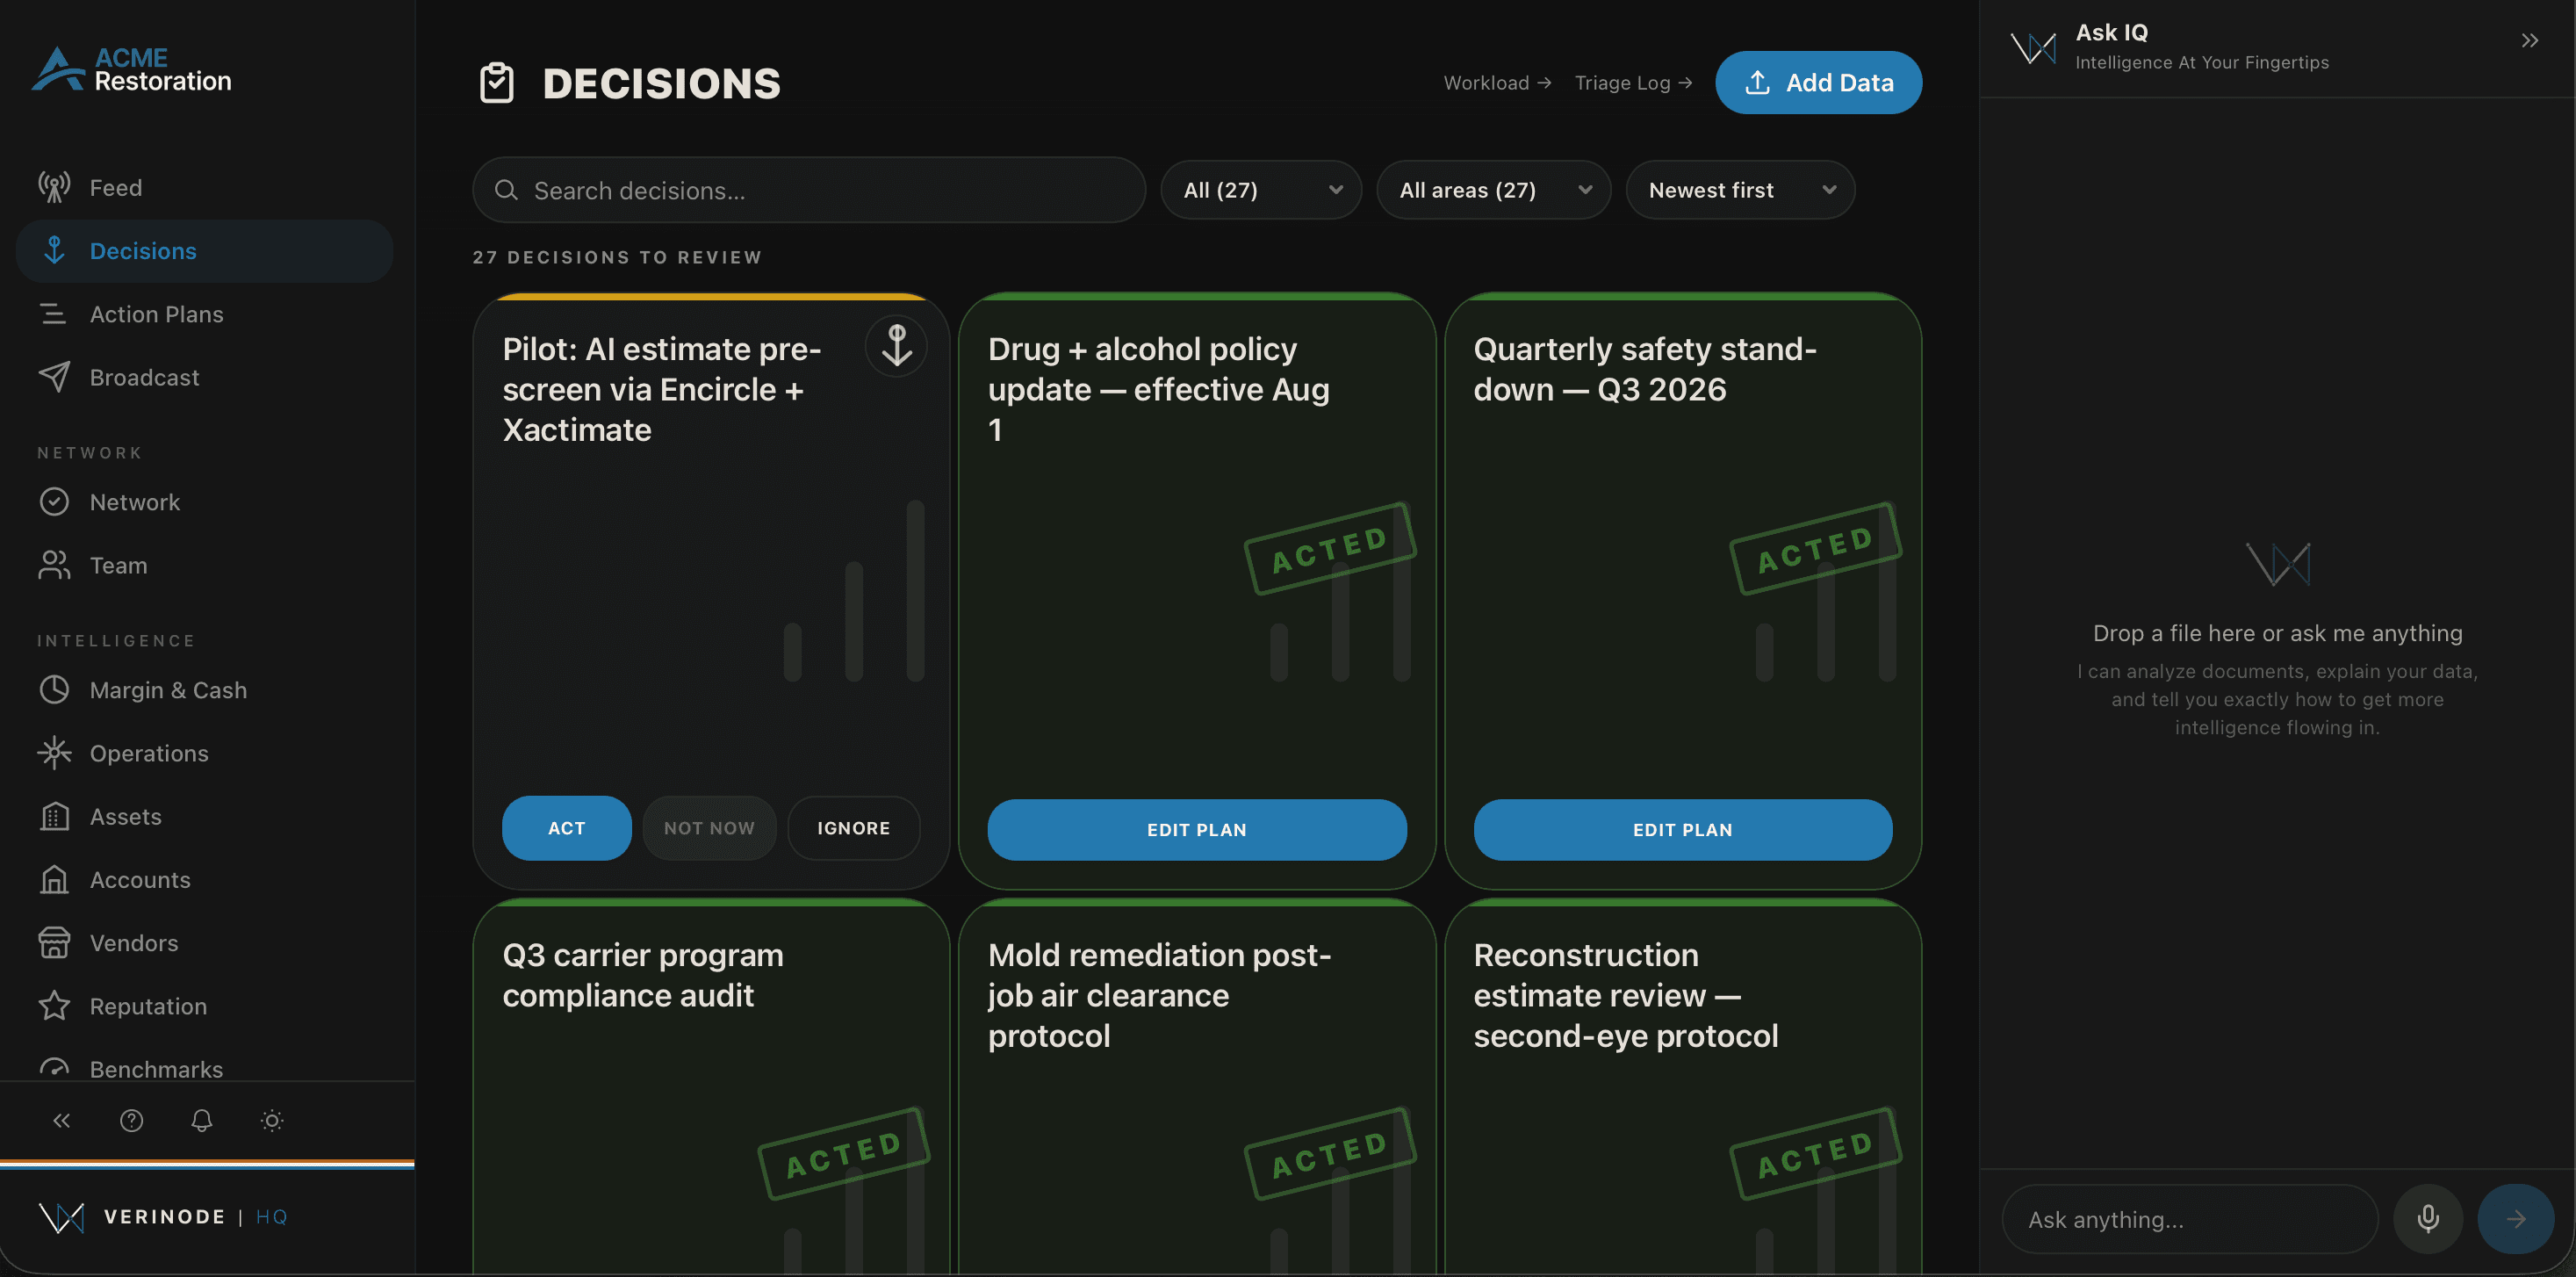
Day one after close, the new operator is already on the line.
A platform doing add-on acquisitions can't wait a quarter to see what it bought. Verinode reads a new operator the same way it reads the rest of the portfolio, normalized and benchmarked from the day it comes onto the product, and the board pack writes itself from live data instead of a scramble of spreadsheets.
app.verinode.ai · HQ
How It Works For You
Operators contribute
Each operator runs Verinode IQ on their own data. Financials and operations roll up to the platform, normalized to one chart of accounts.
The portfolio is ranked
Every operator placed against the portfolio and the wider network on each metric, with drift watched continuously.
The board sees the real number
Margin, cycle time, compliance, and the operators with the most to gain, in a board pack generated from live data, ranked by dollar impact.
Works with Verinode IQ
Every operator runs Verinode IQ.
The network ranking exists because each operator runs Verinode IQ, where their data is normalized and benchmarked. Their numbers roll up to you anonymized, and the benchmarks flow back to them as their own targets.
Rolls up
Each operator's data rolls up from their IQ workspace, anonymized and normalized.
Flows down
The network benchmarks flow back down to each operator as their own targets.
Common Questions
What platform leaders ask first.
What does Verinode do for a PE-backed restoration platform?
It rolls every portfolio operator onto one normalized line, financials mapped to a single chart of accounts, then ranks margin, cycle time, cash, and compliance across the platform and against the wider network. A slipping operator surfaces as a signal with the reason attached, and a board-ready pack is generated from live data instead of assembled from a dozen accounting systems.
How does it handle add-on acquisitions?
Once a new operator is running the product, Verinode reads it the same way it reads the rest of the portfolio: normalized to the same chart of accounts and benchmarked from day one after close. Integration and the first board update start from real numbers rather than a fresh reconciliation, so the platform sees what it bought without waiting a quarter.
How is this different from a BI dashboard or a data warehouse?
A dashboard shows you everything and decides nothing, and a warehouse still leaves you to normalize twelve different books by hand. Verinode reads across the portfolio, normalizes to one restoration chart of accounts, benchmarks each operator against the wider network, and hands leadership the few moves worth the week, drafted and ranked. It ends in decisions, and it's built for restoration specifically.
Who owns the operator data?
Operators own their records. The platform sees aggregates, rankings, and compliance, the things it needs to run the portfolio, not a raw dump of every operator's books. The boundary is contractual and enforced at the database level, and the policy, architecture, and methodology are all published.
What Makes It Verinode
Why Operators Join
The platforms that create value fastest see the whole portfolio on one line. Verinode is that line.
Twelve accounting systems and a quarterly deck is how value hides. Verinode is how the sharpest platforms read every operator, and every acquisition, from the same number.